How is the impact of each disease changing over time?#
We can address this using the attribution chart with Visualization set to “Over time”.

Fig. 23 Showing attribution over time#
Note: estimates have been produced for 2021. Other years are currently placeholders.
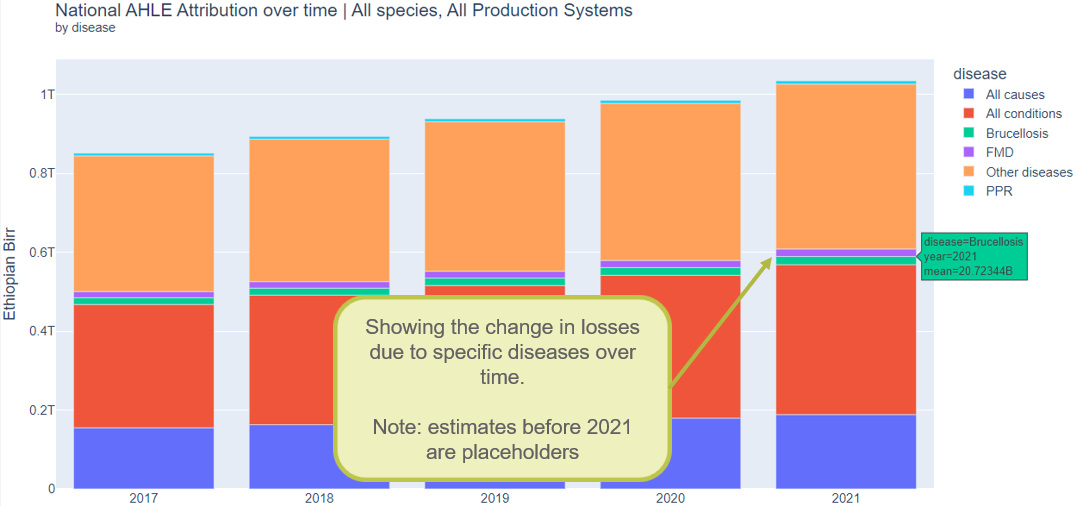
Fig. 24 Showing the change in impact of specific diseases over time#