AHLE Values and Costs#
The value and cost chart shows the major components of revenue and cost under current conditions and compares them to estimates under an ideal scenario with no disease burden. Blue bars indicate a positive value (revenue) and red bars indicate a negative value (cost). The orange bar is the gross margin, calculated as the sum of all revenues minus costs. The value components displayed depend on the selected species because some, such as milk and hides, are not produced for all species.
The controls for the value and cost chart are:
Display
This sets the chart to display either side-by-side bars for the current and ideal scenarios or the difference between them. Set this to difference to see the estimated additional revenue if there were no losses due to disease.

Fig. 4 Display options for AHLE values and costs#
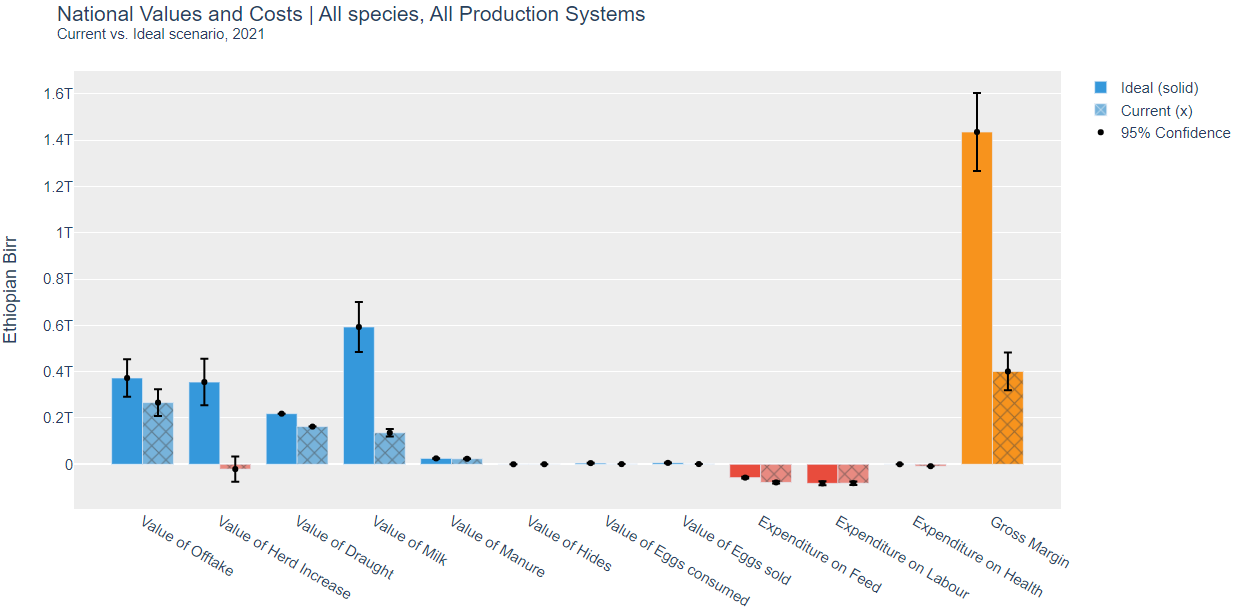
Fig. 5 Showing values and costs for the current and ideal scenarios side by side#
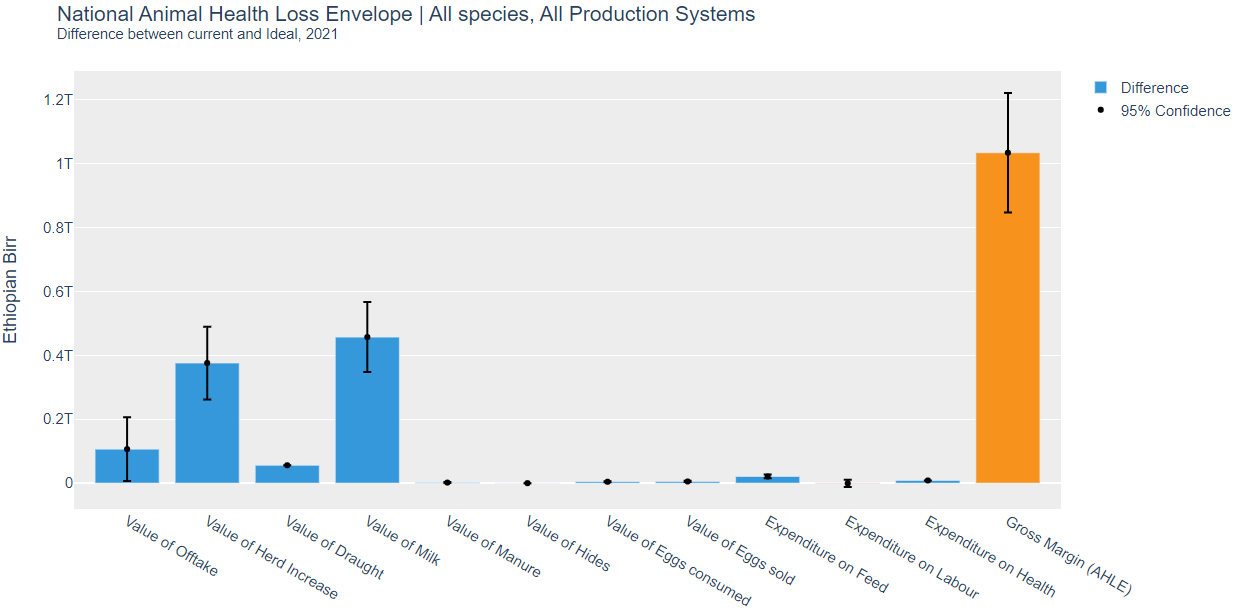
Fig. 6 Showing the change in each value and cost when moving from the current to the ideal scenario#
Comparison
This selects the scenario to compare to. Scenarios are:
Ideal: reflecting an ideal scenario with zero mortality and improved fertility and growth rate.
Improvement: allows a selection of scenarios with partial improvements to mortality, fertility, or growth rate.

Fig. 7 Comparison options for AHLE values and costs#
Improvement Factor
If Improvement is selected, use this dropdown to select a factor to define a partial-improvement scenario.
Mortality
Live Weight
Parturition Rate