Attribution#
The attribution chart is a tree map showing the estimated attribution of the AHLE to infectious, non-infectious, and external factors. This can be split further to show the attribution to specific diseases and loss components (mortality, production loss, and health cost).
Important note: attribution is estimated for species groups rather than for individual species.
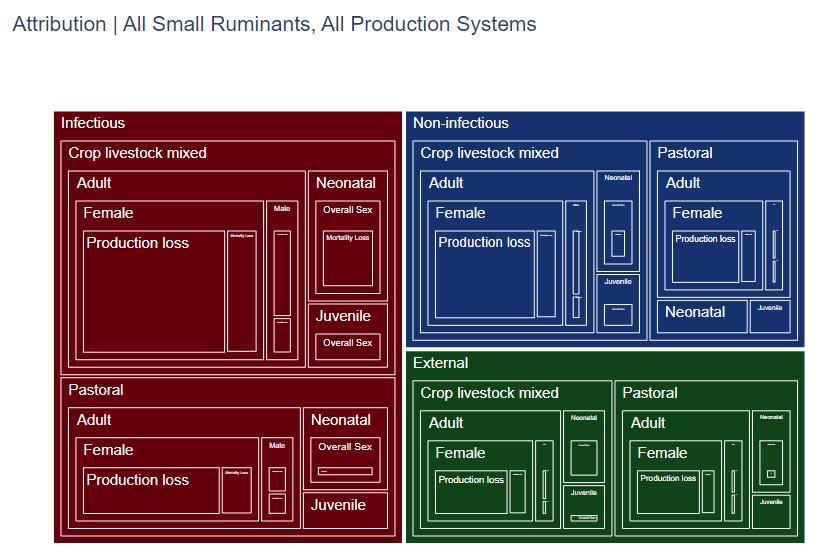
Fig. 11 Example attribution chart#
The controls for the attribution chart allow the user to select up to 5 variables to display the results sliced by lower levels of aggregation. By default, all 5 variable fields are populated, showing the most detail in the chart. All grouping variables except for the first can be set to None to show a simpler chart.
The available variables are:
Cause: show the contribution of infectious disease, non-infectious disease, and external causes.
Disease: show the contribution of individual diseases. NOTE: only some diseases have been individually attributed. The rest are shown as “Other diseases”.
AHLE Component: Mortality, Production Loss, or Health Costs. NOTE: Health Costs make up the smallest proportion of AHLE and may not be visible in the chart.
Production System: show the impact of disease on each production system relevant to the selected species: crop livestock mixed, pastoral, periurban dairy, etc.
Age Group: show the impact of disease on each age group relevant to the selected species: neonate, juvenile, adult.
Sex: show the impact of disease on each sex: male or female. Oxen will also be displayed for cattle.