Educational Materials and Best Practices
Best Practices for Coding
GBADs members most commonly use R and Python for coding, cleaning, and organizing data, and constructing their models. Best practices for coding conventions allow code to be readable and reusable. These are the best practices that GBADs Informatics and modellers suggest to ensure that we can understand and use code.
R Coding Best Practices
1. Naming Conventions
File naming
Standard naming conventions are used for the file name, and for all variables and functions defined in your code.
File names should follow the dateOfCreation_meaningfulCodeName.R format.
For example, if my code cleans and reformats livestock data, I might call my script 20210703_faoLivestockProductionDataCleaning.R
More on our standard date and time convention is covered in standard date and time convention
Variable naming
Use snake_case for naming variables and functions in your code. Using a standardized naming convention improves code readability and interpretability.
Use meaningful names when naming variables and functions. The name of the object should reflect its utility or characteristics. For example, if you are reading in a livestock production dataframe:
livestock_df <- read_csv('path/to/my/important/file.csv')
setwd() to set the working directory for your project or script, the working directory is distinct to your computer and may decrease the level of reproducibility of your code. 2. Organize the format of your code
Start your script with the name of the creator, date that the script was last edited (in ISO 8601), and a brief description of the purpose of the script.
####################################
# Creator: Kassy Raymond
# Email: kraymond@uoguelph.ca
# Date last edited: 20210803
#
# This program contains code that performs principal component analysis (PCA)
# on livestock production data from Ethiopia. The data that was used in this
# program is from the FAOSTAT production dataset and was downloaded on
# 2021-08-03. The output data from this script will be used in a model that
# calculates biomass.
#
####################################
Document your code with comments so that the reader of your code (or future you) can follow each step that you took in your script.
Load in all libraries at the beginning of your program. In R, this might look like this:
## 0 - Load in all libraries

library(tidyverse)
library(ggplot2)
library(knitr)
library(readr)
library(forcats)
library(dplyr)
When possible, segment your code into sections. This helps with reproducibility and makes code more readable.
## 0 - Load in all libraries

library(tidyverse)
library(ggplot2)
library(knitr)
library(readr)
library(forcats)
library(dplyr)

## 1 - Source files

data_path <- 'path/to/my/important/file.csv'
livestock_df <- read_csv(data_path)

## 2 - Data cleaning

# Drop unneeded columns

# Check for NAs

# Explore data and check for outliers or errors in data

## 3 - Modeling
3. Data cleaning
3.1 Drop unneeded columns early on in your code
If you are not using a column in further analysis, drop it in the data cleaning and exploration phase of your script. This will improve interpretability of your code and increase the processing speed of your program.
3.2 Remember data provenance
It is important that the estimates, models, graphics and output datasets created by models can be reproduced. It is therefore important to include the original dataset used, or when APIs are used, the ability to trace back to original dataset.
If you downloaded your data, make sure you save a copy of the original dataset and do not overwrite this in your workflow.
If an API call was made to get the data, ensure that the date stamp of that call is provided in the name of your output dataset, models, or graphics that are created. You may also again, choose, to save a copy of the original dataset.
3.3 Ensure data is in a 'tidy' format at the end of the data cleaning phase
See also Organizing Spreadsheets in these educational materials and R for Data Science by Hadley Wickham.
3.4 Organize data
Organize data from left to right with categorical variables and then continuous variables. Variables should be grouped together where relevant (e.g. stocking density at thinning, weight at thinning, date of thinning etc.)
4. Other recommendations
- Try RStudio for your IDE!
Organizing Data in Spreadsheets
"Garbage in, Garbage out"
If you are reading this, you probably spend a lot of timing dealing with data. You might collect it, clean it, model it, share it, attempt to interpret it and then do the whole thing over again. When you recieve data from a collegue, you might try to clean it again (even if it's already been cleaned), try to interpret it and might even have to write several emails to interpret the data.
In this part of the handbook, we tell you how you can better organize your data in spreadsheets to create higher quality data, leading to higher quality models. We also define some standard practices for inputting data of specific types including dates and long numbers.
Spreadsheets and datasets
Spreadsheets, such as those made in Microsoft Excel and Google Sheets are common for storing, entering, sharing and manipulating data from research. Spreadsheets are commonly shared to communicate research results and used as input data for models or statistical analysis. While spreadsheets are an integral part of the data lifecycle, they must be structured properly to ensure that mistakes are not made that lead to data being unable to be reused or interpreted. Small mistakes in spreadsheets can leave us in situations where data are hard to understand, hard to analyze and time consuming to clean.
NOTE
Please contact the GBADs Informatics team if you are a GBADs member who has many spreadsheets of 'untidy' data! We can consult, and think about how to create a program that will wrangle and transform your data into a tidy format!
Structuring data properly in spreadsheets leads to data being more reusable and interoperable (FAIR), leading to higher quality data and ultimately better research. By setting up spreadsheets to be ingested in statistical softwares or libraries from the get-go we can minimize confusion and simplify our workflows.
Learning Objectives
- Readers should understand how to structure a dataset in a spreadsheet in a manner that supports FAIR data principles
- Readers should understand how to structure their dataset to preserve the semantics (underlying meaning) of the data
- Readers should understand how to structure dates and long numbers in spreadsheets and why it is important that these data are machine readable
- Readers should understand common mistakes that make messy datasets and how to avoid them
Data structure
"Tidy datasets are all alike, but every messy dataset is messy in its own way."
In general, a tidy or clean dataset is made up of the following 1:
Columns (Variables)
- Columns are a group of cells aligned vertically. In datasets, columns are variables, where each cell holds a piece of information about a given attribute.
Rows (Observations)
- Rows are a group of cells that are aligned horizontally, where each row is an observation.
Cells (Values)
- In datasets, each row is an observation and each cell in that row holds the value of the column where it falls.
 Rules that make a tidy dataset: columns are variables, observations are rows and values are cells. Image and caption from 1.
Sticking to a tidy data format enables data reusability, ensures consistancy (which improves data quality), and helps to understand the underlying meaning (semantics) of each of the values in the spreadsheet. Having columns as variables and rows as observations allows us to know what a value means based on it's relation to the variables and observations.
FAIR data is tidy data - tidy data is reusable and interoperable by nature. Tidy data is more findable, because headers are well defined, making metadata creation easier. Fundamentally, we can draw more information from tidy data.
Saving spreadsheets
Datasets in spreadsheets can be saved as an excel file or in .csv (comma separated value) or .txt format. The latter two are preferred as they are easier to read into programming libraries in R and python.
Standard date and time convention
Without a standard convention, dates can present a lot of ambiguity. For example, 01/11 could be interpreted as January 2011, November 2001 or November 1st. For this reason, it is important to use an internationally accepted date standard so we can relabily understand our data.
GBADs will use the ISO 8601 standard for dates. ISO 8601 is an internationally accepted standard that uses the Gregorian calendar.
Dates are represented as:
- YYYY-MM-DD or YYYYMMDD
The ISO 8601 standard uses the 24 hour clock. Times can therefore be entered as:
- T[hh:mm:ss]
or if seconds are not applicable:
- T[hh:mm]
and if minutes are not applicable:
- T[hh]
Since GBADs is a global organization, it is important to specify time zones entering time into spreadsheets. Time zones are specified following the date by specifying how far behind or ahead the time zone is from UTC.
For example: Saturday 10 July 2021 at 13:48 EDT is written as 2021-07-10T13:48-4:00
Different calendars for different countries
When analyzing datasets from different countries be aware that not all parts of the world use the Gregorian calendar.
For example, Ethiopia uses the Ethiopian calendar, which is different from the Gregorian calendar. This puts Ethiopia 7 years behind the calendar used in Europe and North America. Here is a tool that allows you to convert from the Gregorian to the Ethiopian calendar.
Large number conventions
Depending on the country, there are different conventions for large numbers.
For example the number 133333.450 can be represented different ways:
In English speaking countries the number could look like this:
- 133,333.450
In non-English speaking countries, like this:
- 133.333,450
So - the same number but represented 3 different ways. This leaves a lot up to interpretation, especially since the default when reading most files into statistical programming languages assumes that a comma specifies a new column. And because much of the work GBADs does relies on programming languages such as R and python, it is really important to structure our numbers so that they can be easily read in and interpreted and read by machines too!
To keep things clear we should structure our large numbers without commas, and reserve periods to specify a decimal place.
If you see a comma where you think it shouldn't be...
If the formatting of large numbers is unclear to you, ask the data owner for clarification! If the data owner is part of the GBADs programme, gently suggest that they use the standards used and set forth by the program (you could even send this chapter along).
File naming convention
When naming files you should be consistent, be descriptive, avoid characters and spaces, and include the date (preferably using a standard such as ISO 8601. For the purposes of file naming convention, we will omit the dashes between YYYY-MM-DD.
Examples of good file naming conventions:
When dealing with data downloaded from organizations:
- YYYYMMDD_organization_topic_species_country
- 20210617_FAO_ProductionPrices_Poultry_Ethiopia.csv
- 20210617_WorldBank_LSMS_Ethiopia.csv
Where YYYYMMDD is the date that you downloaded the file.
If it is a metadata file, you should name the file with 'metadata' and the file name as above to know which metadata file corresponds to the proper dataset. For example:
- 20210617_FAO_ProductionPrices_Poultry_Ethiopia_metadata.csv
- 20210617_WorldBank_LSMS_Ethiopia_metadata.csv
Examples of poorly named files:
- FAO Production Prices - downloaded by Kassy on April 25.csv
- Ethiopian production prices from the fao stat website.csv
- ETHPRODPRICES_GOODCOPY.csv
Dates first
Putting the date first in a file allows you to easily organize files in a directory or folder by ascending or descending date.
Common Errors
Formatting, highlighting and bolding should be avoided. Here's why making spreadsheets pretty causes headaches in the data analysis lifecycle:
7 common errors that make spreadsheets messy
- Multiple tables in one spreadsheet
- Bad null values (a zero does not mean null)
- Cells are merged
- Units of measurement are included in values instead of column names
- Formatting is used to represent information
- Cells contain more than one piece of information
- Standard date format is not used
1. Multiple tables in one spreadsheet
Having multiple tables in one spreadsheets often leads to unnecessary data cleaning for any further data processing. Multiple tables in one spreadsheet leads to confusion when we share the spreadsheet or come back to it at a later date. If a row is an observation, creating multiple tables goes against this notion, lowering the quality and ability to interpret the data set.
In the example below, which is made up of fabricated data, there are 4 tables in a single spreadsheet. In each table, the 'item' is the observation and the number of live animals in a given year is what is being measured. However, because of the way the spreadsheet is set up, it is difficult know whether both of the upper tables are associated with Canada, or if the table on the right is missing a header.

A better way to set up the data would be like this:

Here we see that all of the information is still provided, but each row is an observation for a given country, item and year. In addition to improving the interpretabiltiy of the data, this data can now be inputted into a statistical software such as R without extensive data cleaning.
2. Bad null values
Missing or null values should be denoted in a standard way that is distinguishable from a quantitative value of 0. This way, the dataset reader will understand which data are missing or unknown and which have a value of 0. The most important thing when recording missing values is consistency; if you decide to use "NA" to denote missing values, ensure that you do not switch to lower case ("na") or "Not Applicable" later in the spreadsheet.
Depending on the statisical software, the meaning of "NA" can vary. For example, in R, NA is a reserved term for a missing value. The way NA values are represented in python varies depending on the library being used. In pandas (a popular python library for data analysis, cleaning and wrangling), NA values are represented by NaN or None. However, as long as we are consistent in the way we represent NA values when inputting and analyzing data, we can quickly change between formats depending on the statistical or programming software that we chose.
3. Cells are merged
Merging cells goes against the notion of rows being observations and each column being a variable. Not only does merging cells go against these principles, it makes it impossible to sort columns and rows, cause errors when reading in data to statistical softwares and introduces the potential of misinterpreting data or losing information. For example, using merged cells to link two rows together causes confusion when you come back to look at the data. Or, if the merged formatting is lost, you bring the potential of losing an entire observation or variables in a given observation.
4. Units of measurement are included in values instead of column names
As each column represents a variable, the units of measure should be consistent through that entire column. Therefore, when applicable, you should include the unit of measure in the column header.
5. Formatting is used to represent information
Highlighting cells and bolding or italicizing information should be avoided as a means to represent information in a dataset. This is problematic because if the formatting is lost, you lose valuable information. If you would like to include the information articulated by the formatting in your model or analysis, you would be required to clean the sheet in excel before reading it in your software.
For example, when testing samples for disease, one might use highlighting to show which samples came back positive. If the formatting is lost, or someone does not know the context of what the highlight means, this information is lost.
6. Cells contain more than one piece of information
When cells contain more than one piece of information, it limits how you can analyze a pre-existing dataset and usually leads to more data cleaning. For example, you might be reporting breed types and counts in your dataset.
In this case you would want to report the breed and count in separate columns like this:
| Breed | Count | Farm | DateCounted |
|---|---|---|---|
| Aberdeen Angus | 20 | Canadian Cattle Farms | 2021-06-01 |
| Abergele | 60 | Canadian Cattle Farms | 2021-06-01 |
| Limousin | 10 | Canadian Cattle Farms | 2021-06-01 |
Rather than reporting them in the same cell, like this:
| NumberOfBreed | Farm | DateCounted |
|---|---|---|
| 20 Aberdeen Angus | Canadian Cattle Farms | 2021-06-01 |
| 60 Abergele | Canadian Cattle Farms | 2021-06-01 |
| 10 Limousin | Canadian Cattle Farms | 2021-06-01 |
7. Standard date format is not used
When inputting dates, use a standard such as ISO 8601 (YYYY-MM-DD). This allows you to sort by date, improve interpretability and if needed, convert into other date formats easily. Refer back to the Standard date and time convention section of this section for more information about how GBADs approaches inputting dates and times.
Also - when using dates be sure to specify what the date means. A column header simply entitled 'date' does not provide much context. For example, does date mean the date the data was entered into the spreadsheet? The date a sample was collected? The date a sample was run in the lab? Be sure that other researchers (and future you) know what you were talking about!
Further reading recommendations
R for Data Science by Hadley Wickham
Authors: Kassy Raymond and K. Marie McIntyre
GitHub Tutorial

GitHub is where GBADs stores all code that is produced in GBADs including software development code, data cleaning and reformatting, API development, modelling, dashboard development, and data access code. Here we provide a brief tutorial on the basics of GitHub and a list of educational resources for those who will be using GitHub on a more regular basis.
List of Resources
Here is a list of some of our favourite resources for getting started with GitHub:
Useful YouTube tutorial
E-Books for GitHub
- Introduction To Git and GitHub by Bobby Ilieu
- Happy Git and GitHub for the useR by Jenny Byran
Quick Blog Posts/Tutorials
- Getting started with GitHub Desktop
- Beginners: Contributing to a GitHub project with GitHub Desktop
- 2 Minutes to Set Up Git, GitHub and GitHub Desktop on Mac
Tutorial/Overview
In this tutorial, you will learn how to use GitHub Desktop to work collaboratively on coding projects and reap the benefits of version control.
In the first part of this tutorial, we will create a new GitHub repository and use the functions of GitHub to create changes and learn GitHub terminology. Then, we will introduce the GitHub repository used for the Animal Health Loss Envelope (AHLE) and how you can start collaborating there.
Learning Objectives:
- Create a repository on GitHub
- Clone repositories to your local machine
- Create changes and commit and push changes to GitHub
- Fetch and pull new changes to update your local repository
Modelling in GBADs:
- Clone the AHLE repository
- Make changes and commit them
- Pull changes that your collaborators are making on the repository
Prerequisites
To follow this tutorial you must:
- Be registered for a GitHub account
- Install GitHub Desktop
Register for a GitHub account
If you don't already have an account on GitHub, you can make one by visiting GitHub and clicking the 'sign up' button the right hand side of the screen.
Install GitHub Desktop
You can install GitHub Desktop from https://desktop.github.com/. Make sure to select the Windows version if you are using Windows or MacOS if you are using a Mac. Follow the installation instructions on the link provided.
Now you are ready to start using GitHub!
Create a repository on GitHub
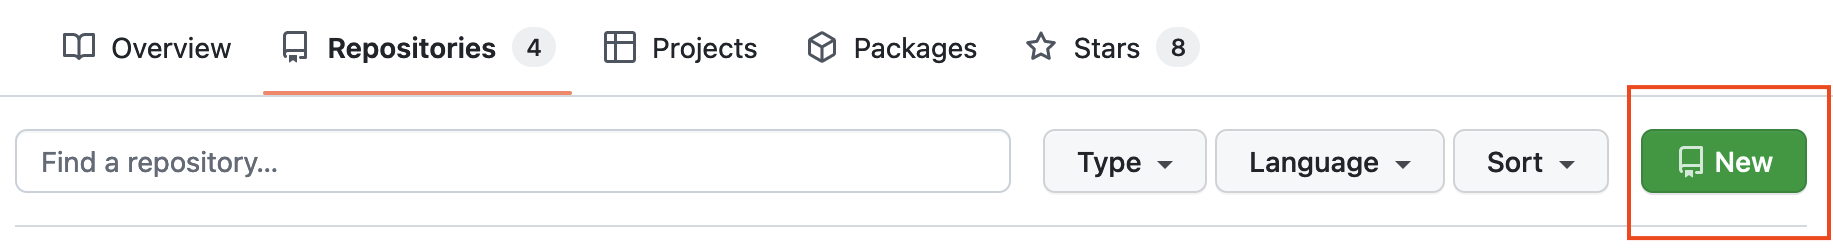
Create a new repository on GitHub by navigating to your profile on https://github.com and selecting the green 'new' button the right side of your screen:
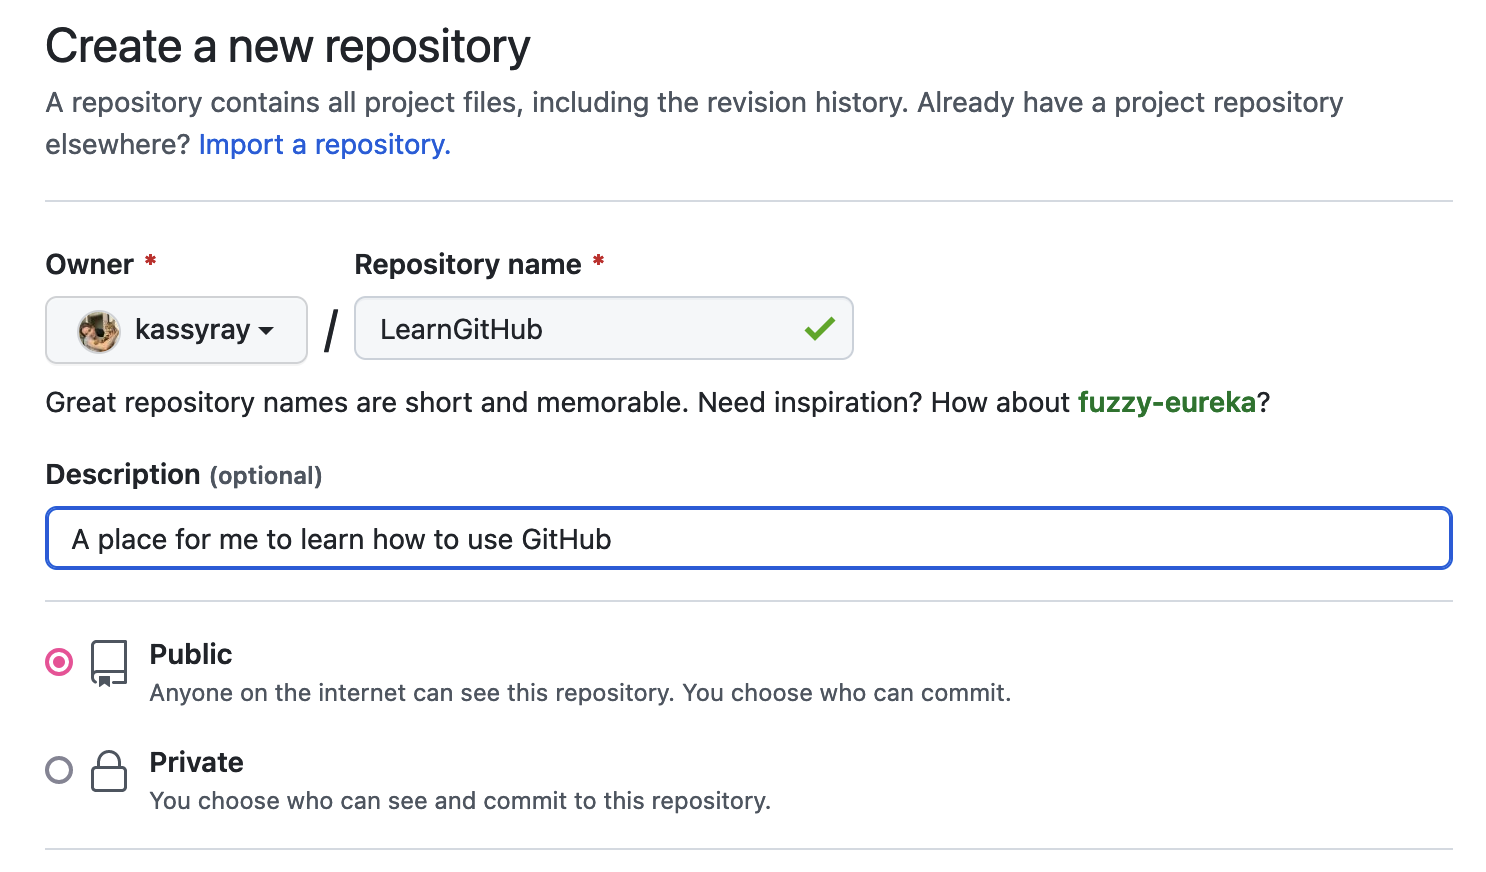
Name your repository GitHubTutorial. Add a description like: "A place for me to learn how to use GitHub".
Now you have a repository on GitHub! Now we have to set it up on your local machine.
Clone a repository
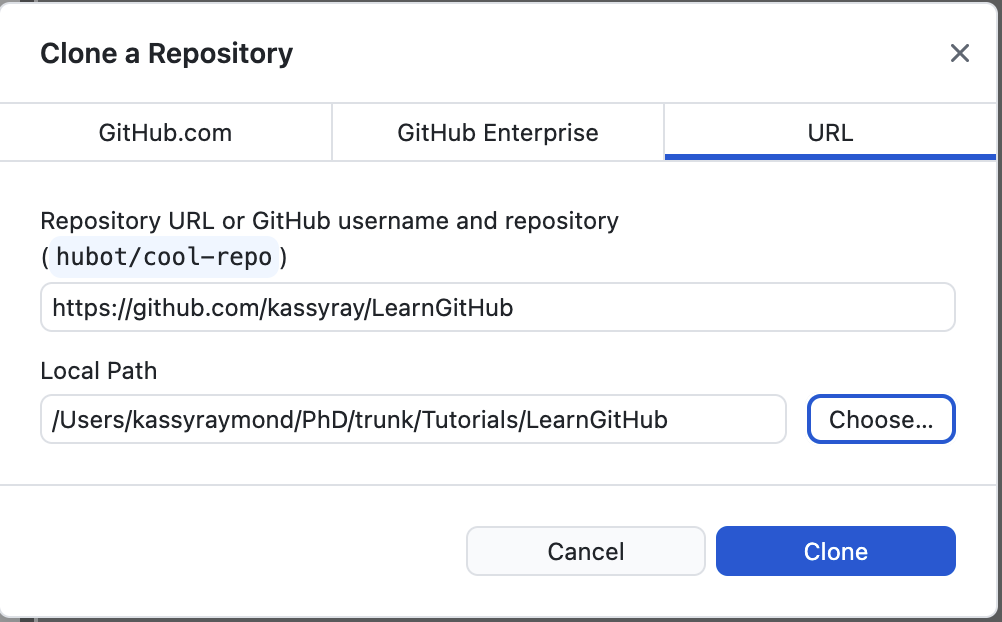
The word 'clone' means to get a copy of the repository on GitHub on your local machine so you can access the repository.
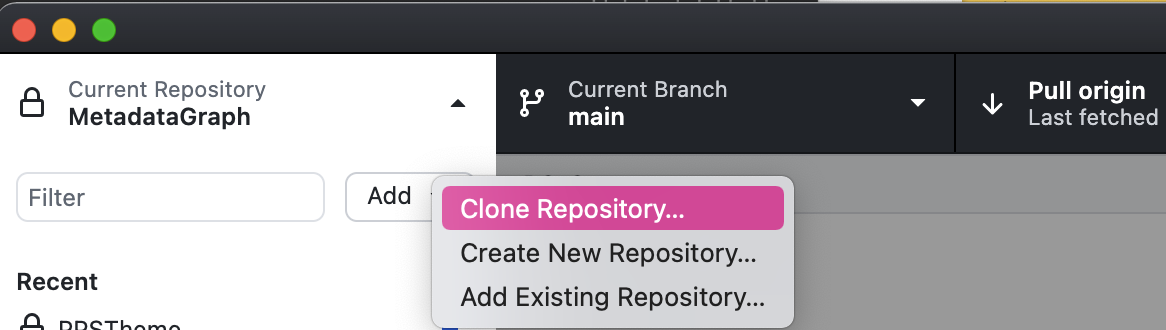
- Open the GitHub Desktop App.
- Select the pane on the left the application window and press the 'add' button.
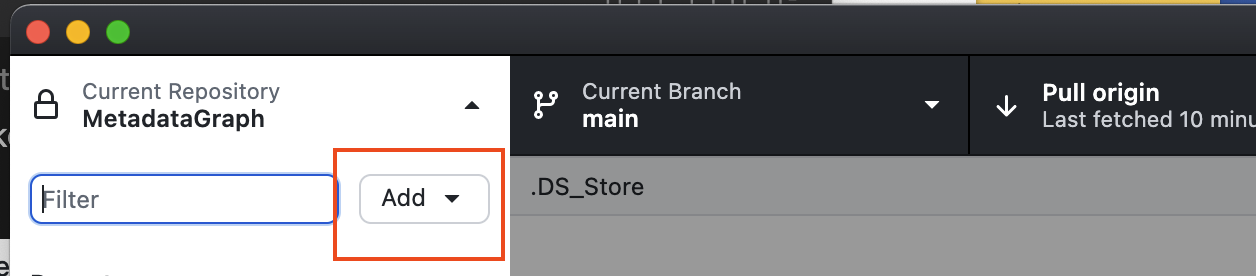
- Press 'clone repository'
-
Copy and paste the URL to the repository that you made on GitHub and specify the path where you would like to put it.
I put the repository in my Tutorials folder in a folder I called LearnGitHub. Then select 'Clone'.
Now you have a copy of your GitHub repository on your local machine! The next thing you will learn to do is add files to your repository.
Add to your repository
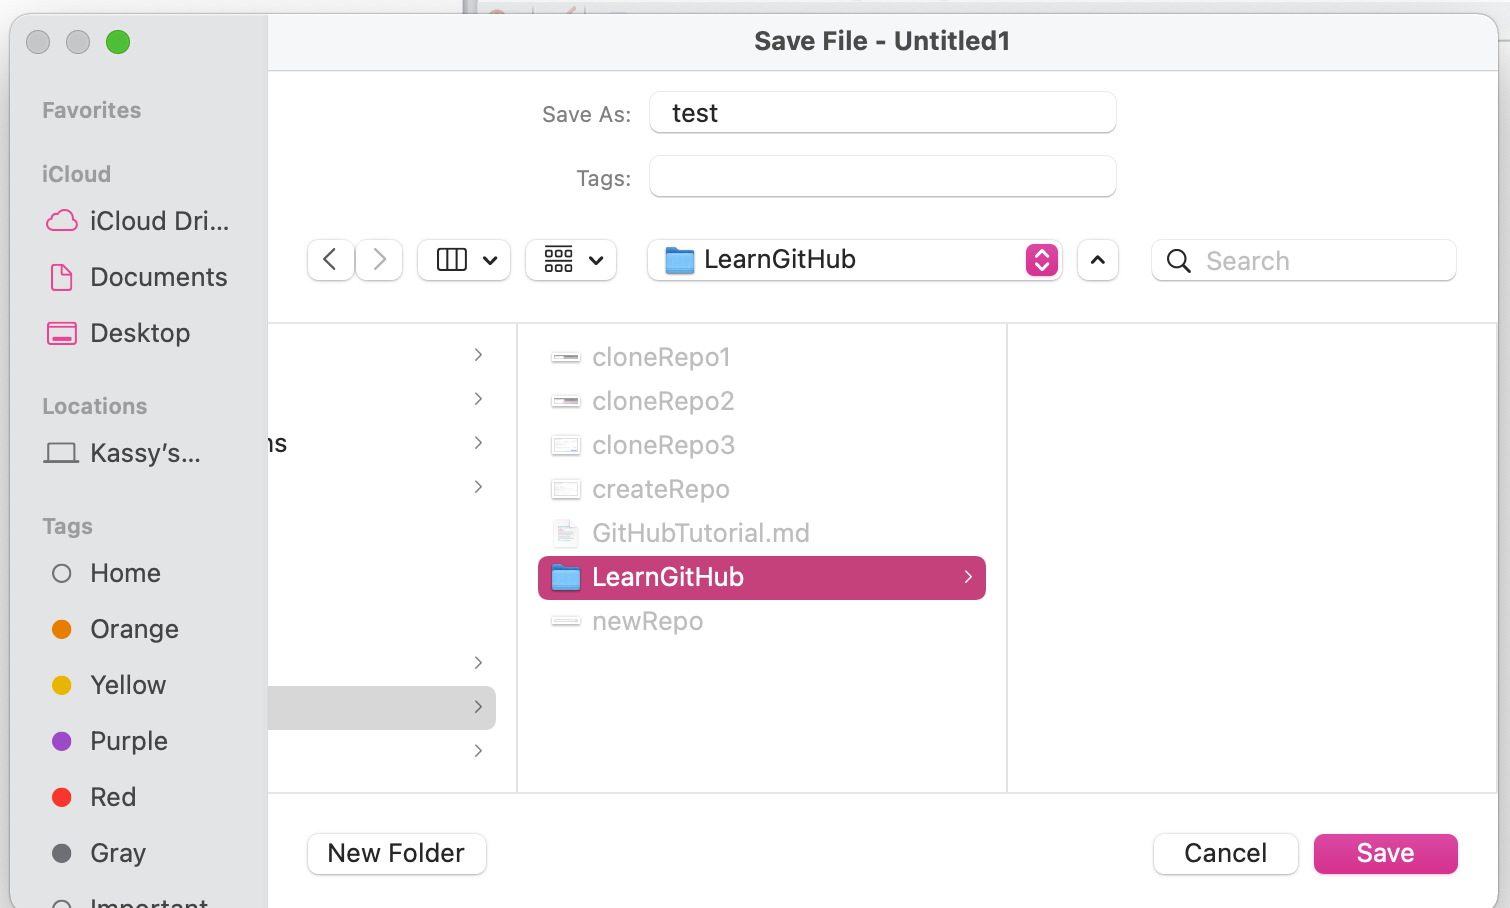
Create a file to add to your GitHub repository.
For example, you can add an R script. Open RStudio and create a new file. Save your file in the directory where you your GitHub repository is. For example, I would save mine in /Users/kassyraymond/PhD/trunk/Tutorials/LearnGithub
Now when I open the GitHub Desktop application I will see that the file I created called test.R appears on the left pane of the window.
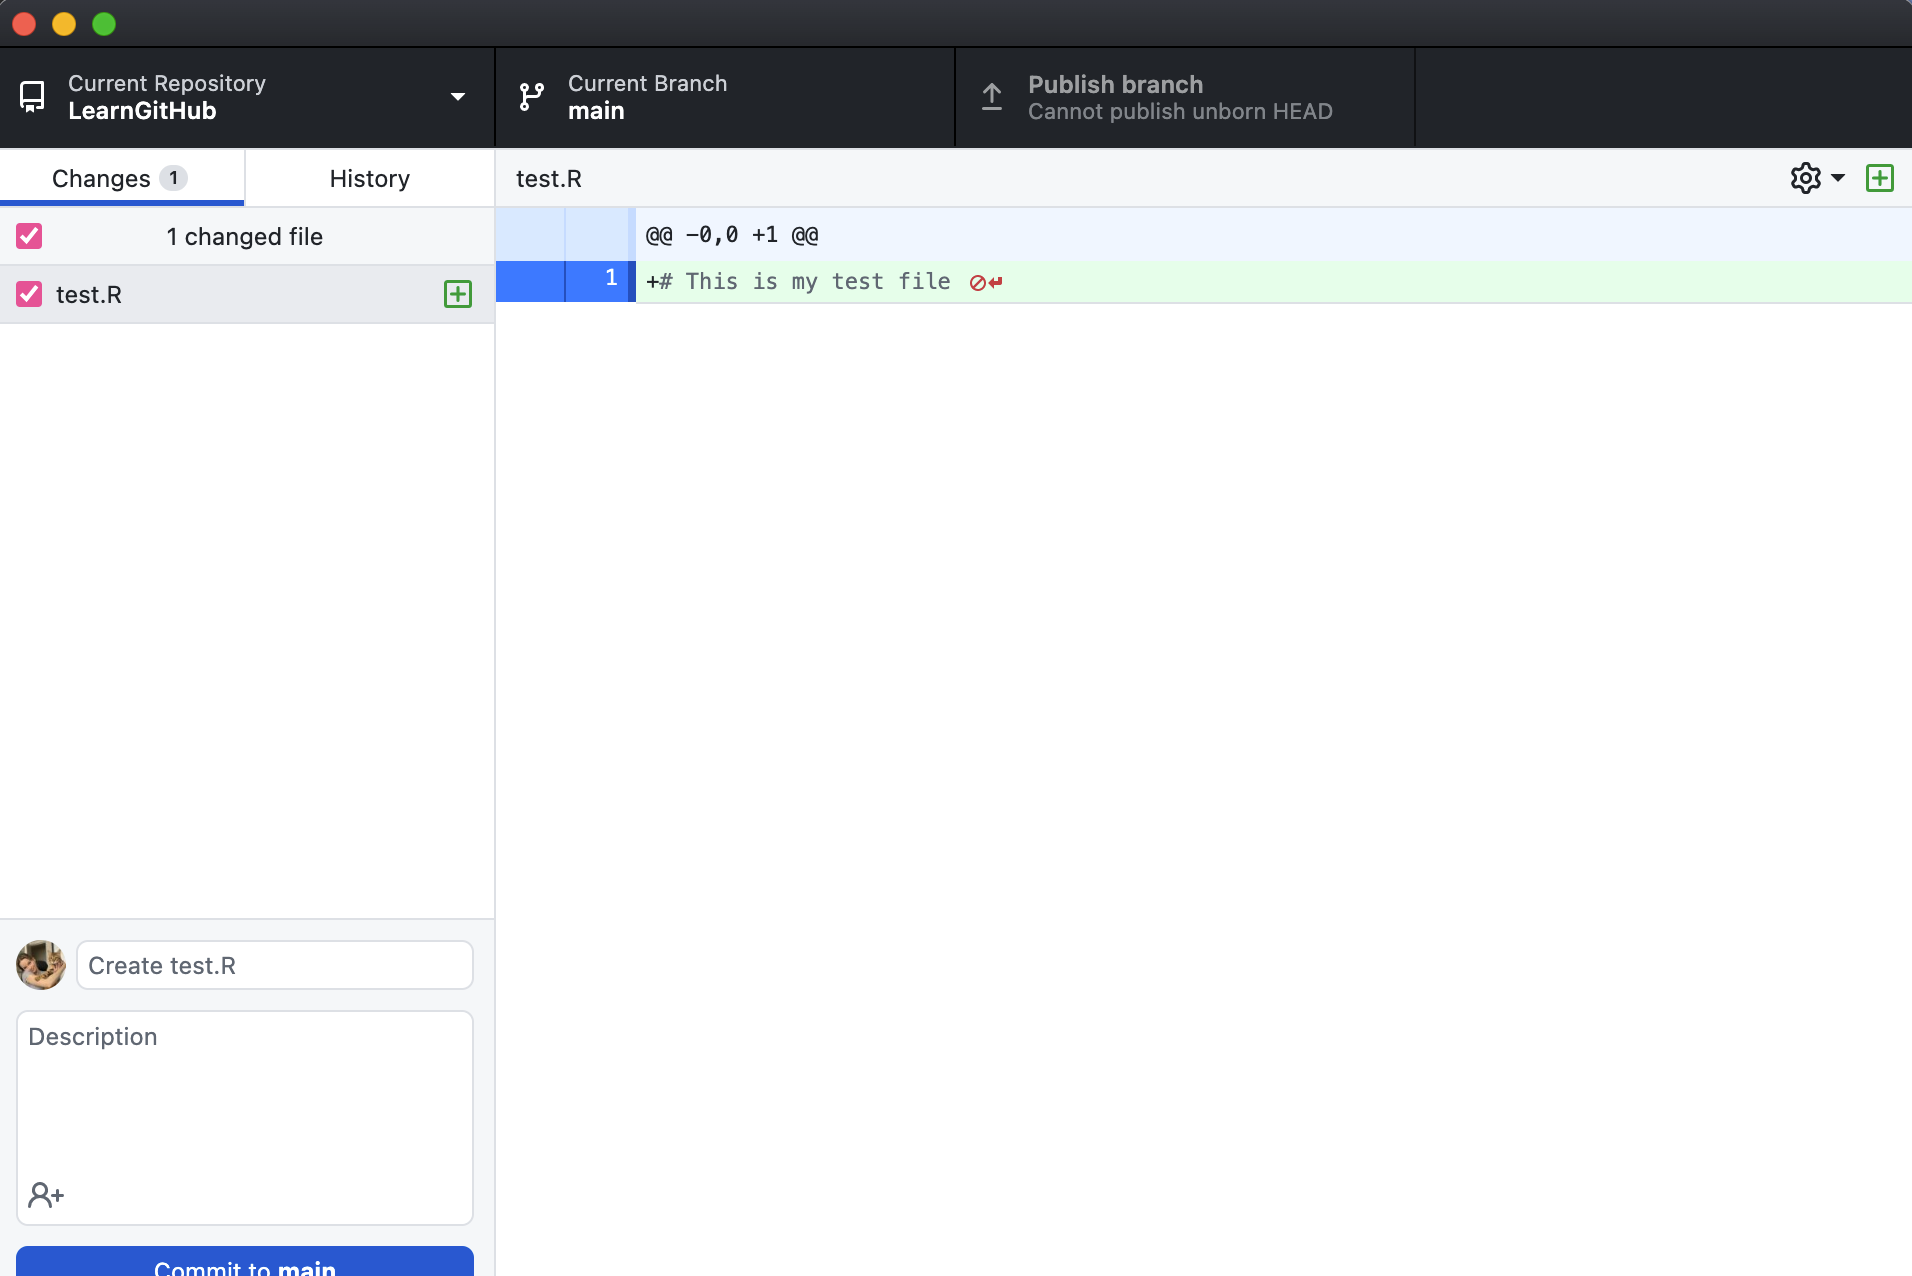
This file is only saved locally, so to get the file in GitHub (the remote repository), I have to commit my changes and push them to the remote repository.
Committing and pushing changes
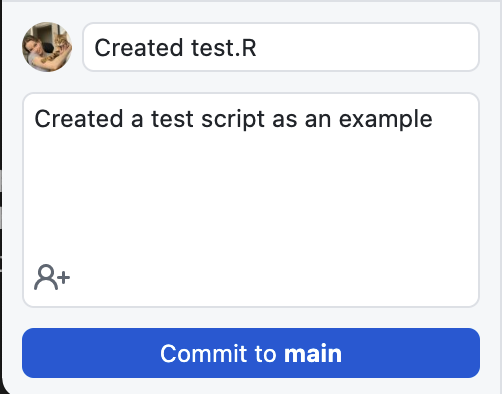
Git Commit
To commit your changes you can add a title. In this case, my title might be something like "Created test.R". Then you can add a description about what you did, what changes you made to your script, or what you are adding to the repository.
Git Push
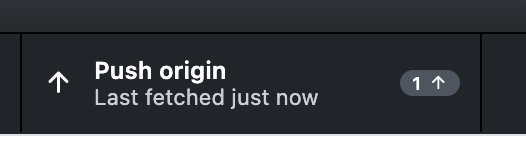
The next thing you have to do is 'push' your changes to the remote GitHub repository. This makes your changes available on the remote repository so that your collaborators can see the changes you made and work on the most up-to-date version of your code.
Fetching and pulling new changes
When you are working on the same project with collaborators and they push new changes to GitHub, those changes are stored in the remote repository. To work on the latest version of the code you have to fetch and pull the new changes in the GitHub repository.
To get the new changes, press the 'fetch' button on the top of the GitHub Desktop window:

Collaborating on AHLE GitHub
Now that you know the basics of GitHub you are ready to start collaborating on the AHLE GitHub.
First, you will want to clone the AHLE GitHub repository.
So, you are going to go to the AHLE GitHub repository: https://github.com/GBADsInformatics/GBADsLiverpool and copy the URL (or just copy it from this tutorial.)
Then, you will open GitHub Desktop, and clone the repository, just as we did in the previous section.
Now, if you open your file browser, you will see the the AHLE GitHub repository. You can make changes to any file by opening it. When you make a change you can commit and push your changes for your collaborators to see. To get all changes from your collaborators you can fetch and pull changes!