Livestock Antimicrobial Usage by Region & Antimicrobial Importance/Classes
Livestock Antimicrobial Usage by Region & Antimicrobial Importance/Classes#
This section displays the antimicrobial usage data reported to WOAH in 2 charts: a bar chart displaying regional usage of each antimicrobial class or group and a donut chart displaying the proportion of global usage each class makes up.
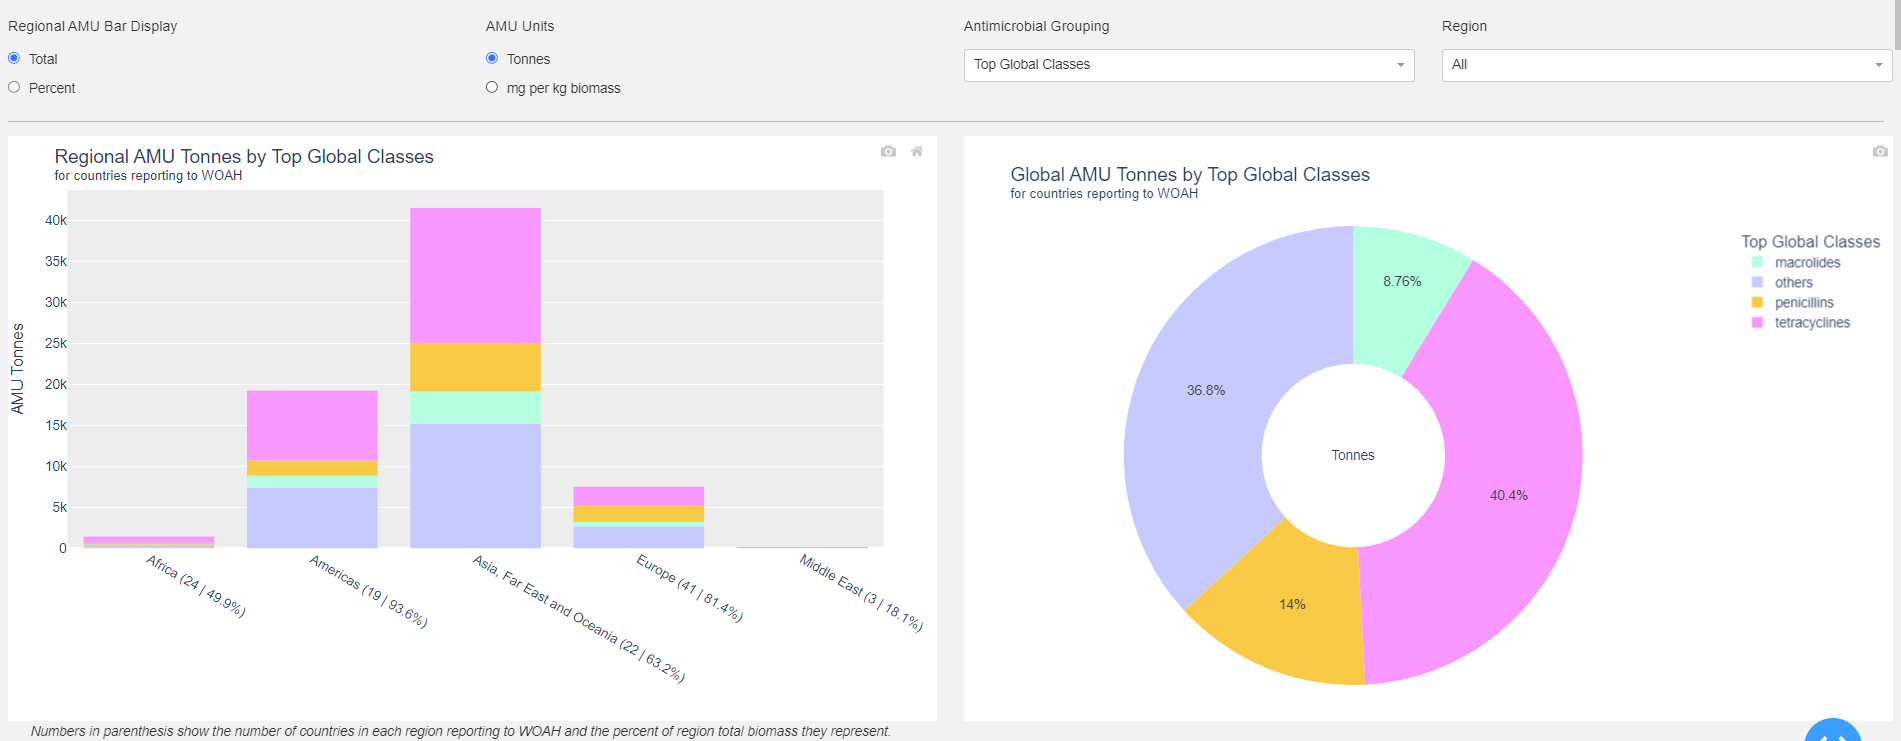
Fig. 10 Antimicrobial usage by region and class#
Use the controls along the top of the page to change how you view the data.
Regional AMU Bar Display
Modifies the bar chart. Select Total to display usage totals for each antimicrobial group within each region. Select Percent to display the percent of the region's total attributed to each antimicrobial group (a 100% stacked bar).
AMU Units
Modifies the bar chart and the donut chart. Select Tonnes to display usage in tonnes of each antimicrobial group. Select mg per kg biomass to display usage in mg per kg biomass, defined for each antimicrobial group and region as (tonnes of antimicrobial) x 1e9 / (kg total biomass for countries reporting in the region).
Antimicrobial Grouping
Determines how antimicrobials are grouped in both the bar chart and donut chart. Options are:
Top Global Classes: Shows the 3 antimicrobial classes with the highest global usage with all other classes grouped into "Others".
WHO Importance Categories: Groups antimicrobial classes according to the World Health Organization's definitions of importance for human health.
WOAH Importance Categories: Groups antimicrobial classes according to the World Organization for Animal Health definitions of importance.
OneHealth Importance Categories: Groups antimicrobial classes according to the Venkateswaran et al., 2023 definitions of importance.
Individual Classes: Shows all antimicrobial classes individually. Very small classes making up less than 2% of global usage are grouped into "Other", or "Other (Important)" if they are classified as important by the OneHealth importance categorization.
Region
Modifies the donut chart. Select All to show the proportion of global usage accounted for by each antimicrobial group. Select a region to show the proportion of usage of each antimicrobial group just within that region.