Visualization of Antimicrobial Usage, Resistance and Expenditure in Livestock by Region
Visualization of Antimicrobial Usage, Resistance and Expenditure in Livestock by Region#
This section shows either a drill down (hierarchical treemap) or a world map. Further options for the chart will appear depending on the chart type and the selection made in the first dropdown box.
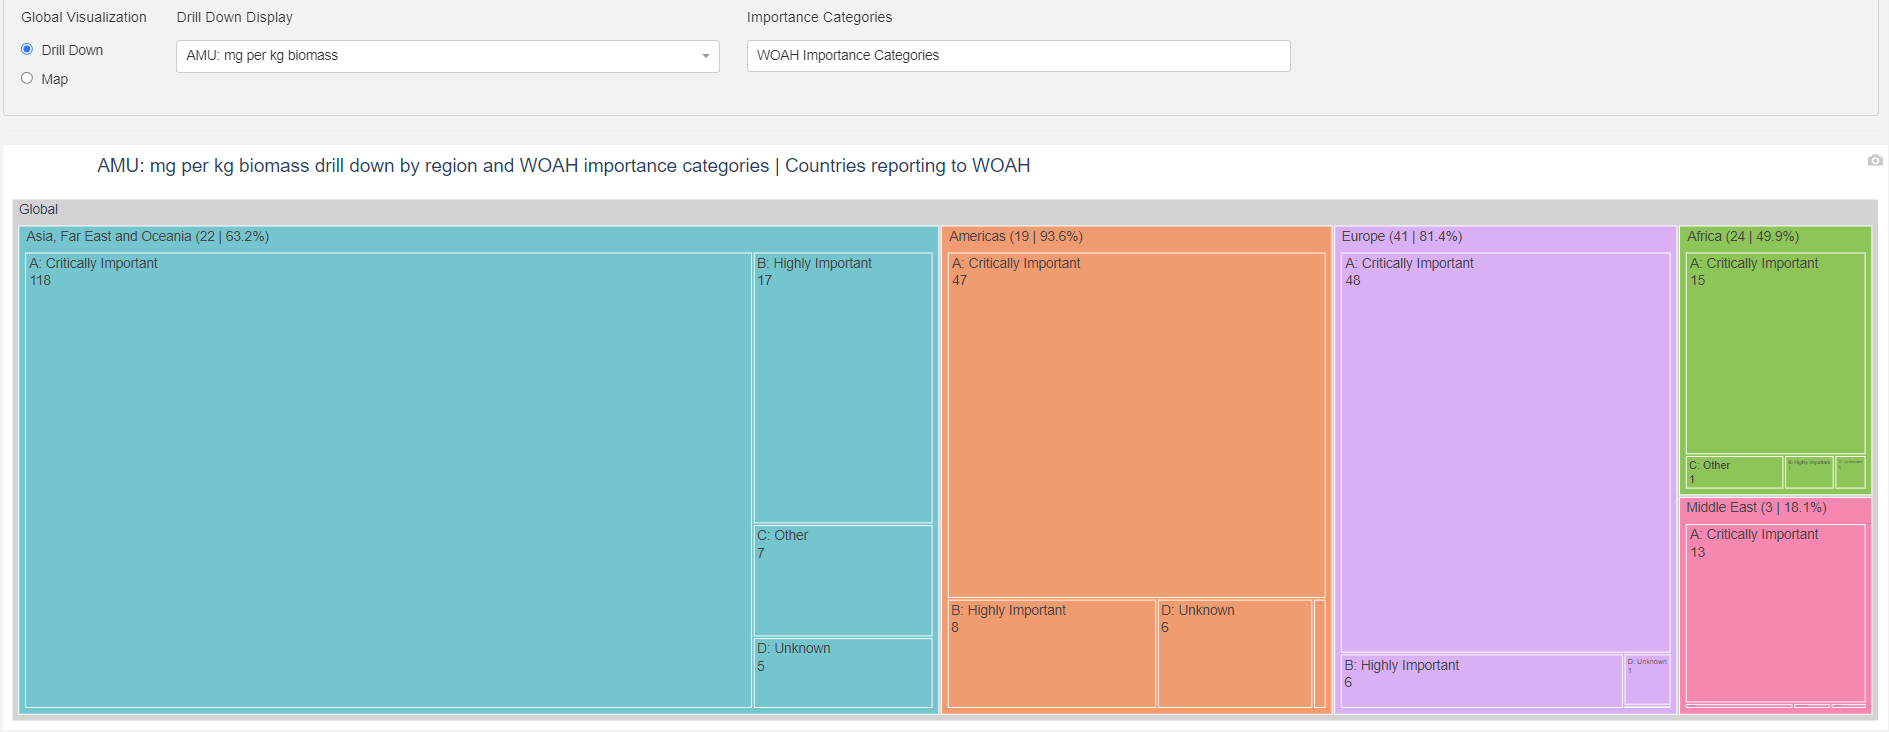
Fig. 11 Hierarchical treemap#
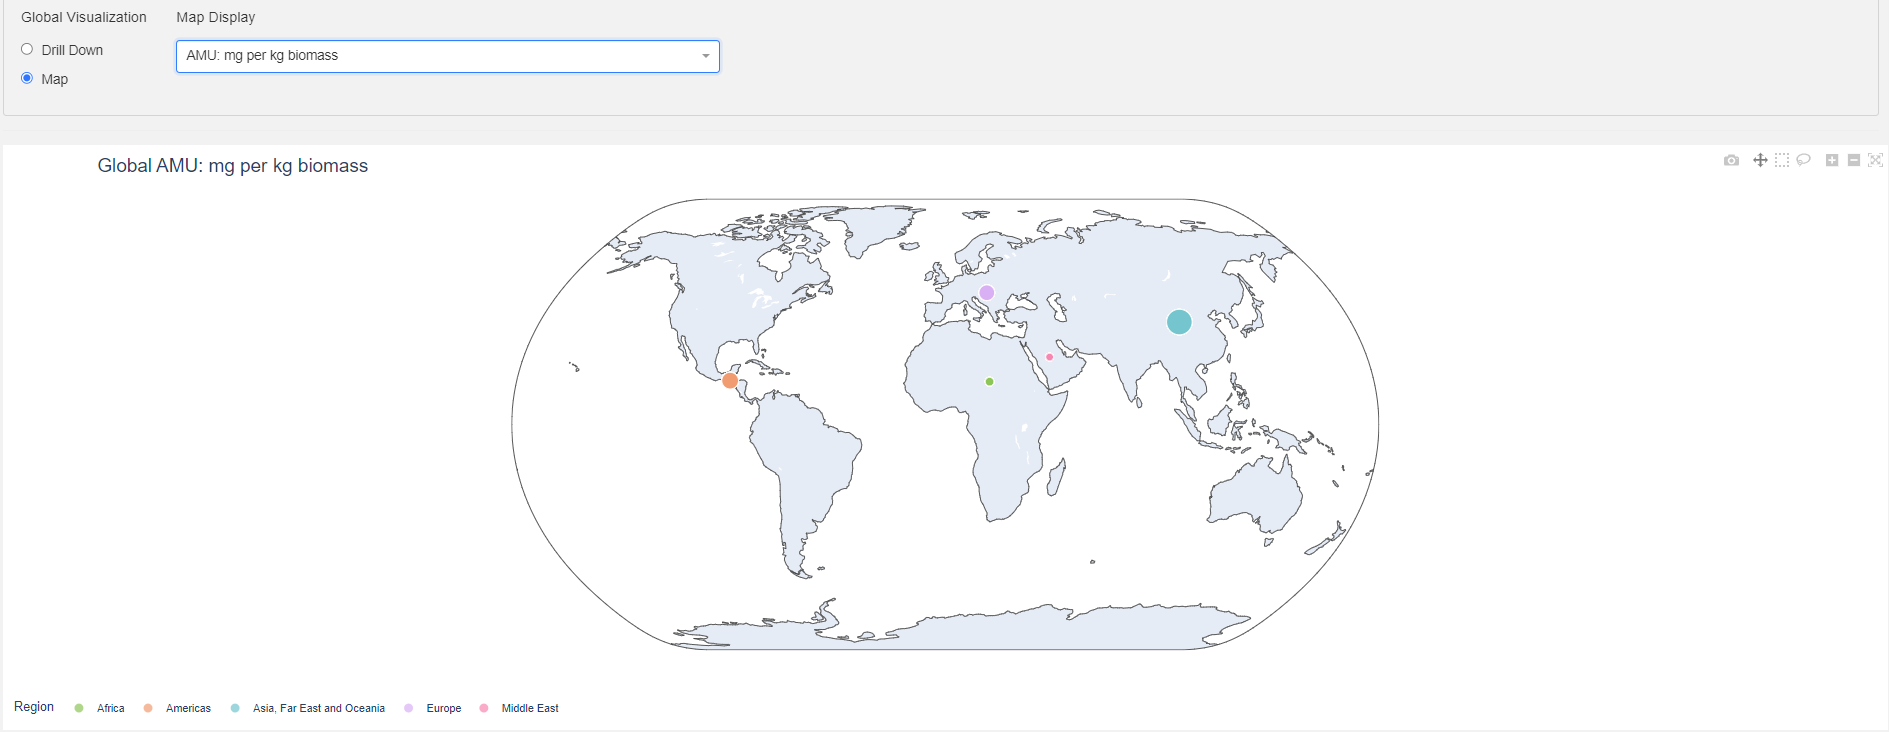
Fig. 12 World map#
Drill Down
The hierarchical treemap displays antimicrobial usage by region and importance category. You can click on any box in this interactive visual to see usage for the individual antimicrobial classes represented in each importance category. There are 2 dropdown boxes to customize the display.
Drill Down Display
Select Antimicrobial Usage: tonnes to display usage in tonnes of each antimicrobial group. Select Antimicrobial Usage: mg per kg biomass to display usage in mg per kg biomass, defined for each antimicrobial group and region as (tonnes of antimicrobial) x 1e9 / (kg total biomass for countries reporting in the region).
Importance Categories
Determines which importance category definitions are used to group antimicrobial classes within regions. Options are:
WHO Importance Categories: Groups antimicrobial classes according to the World Health Organization's definitions of importance for human health.
WOAH Importance Categories: Groups antimicrobial classes according to the World Organization for Animal Health definitions of importance.
OneHealth Importance Categories: Groups antimicrobial classes according to the Venkateswaran et al., 2023 definitions of importance.
Map
The map can display several different metrics. Options are:
Antimicrobial UsageDisplays a dot for each region sized by total antimicrobial usage. Select either Antimicrobial Usage: tonnes or Antimicrobial Usage: mg per kg biomass to display this as total tonnes or mg per kg biomass.
Biomass
Displays a dot for each region sized by total biomass (kg) for countries reporting to WOAH.
Antimicrobial Resistance (country level)
Displays country-level antimicrobial resistance from Venkateswaran et al., 2023. Selecting this option will cause 2 other dropdown boxes to appear: Antimicrobial Class and Pathogen. A dot will appear for each country in the data, sized by the percent of isolates of the selected pathogen that were resistant to the selected antimicrobial class. If a pathogen/antimicrobial class combination is selected for which there is no data, a notification will be displayed.
Drug Resistance Index (region level)
Displays the drug resistance index for each region, calculated as follows: for each region, we calculate the average resistance rate of an indicator pathogen (E. coli) across all antimicrobials tested (Venkateswaran et al., 2023), weighted by the proportion of region-total antimicrobial use that each antimicrobial accounts for in WOAH 2018. This is based on the drug resistance index specified in Laxminarayan 2011, except that we use proportion of region-total antimicrobial use in place of a direct measure of the frequency of use of each antimicrobial. We use E. coli as the indicator pathogen consistent with the rationale in EFSA AMR Indicators 2017.
Antimicrobial expenditure
Displays the antimicrobial expenditure in each region, calculated using the antimicrobial usage and price values selected in the Regional Veterinary Antimicrobial Expenditure Estimator section. By default, this will use the middle values of usage and price for each region, and will update as the user changes those inputs.