Exploring Variability of Veterinary Antimicrobial Usage and Price by Data Source
Exploring Variability of Veterinary Antimicrobial Usage and Price by Data Source#
This section shows a range of possible values for antimicrobial usage and price in each region. These are based on extrapolations from disparate data sources and are largely illustrative.
Sliders allow the user to select usage and price values within the illustrated range. The user-selected values are used to calculate total antimicrobial expenditure for each region and displayed in the expenditure chart. This calculated antimicrobial expenditure is also incorporated into the estimated global aggregate animal health loss envelope and displayed on the Global AHLE Details tab.

Fig. 13 Comparing usage and price estimates by region#
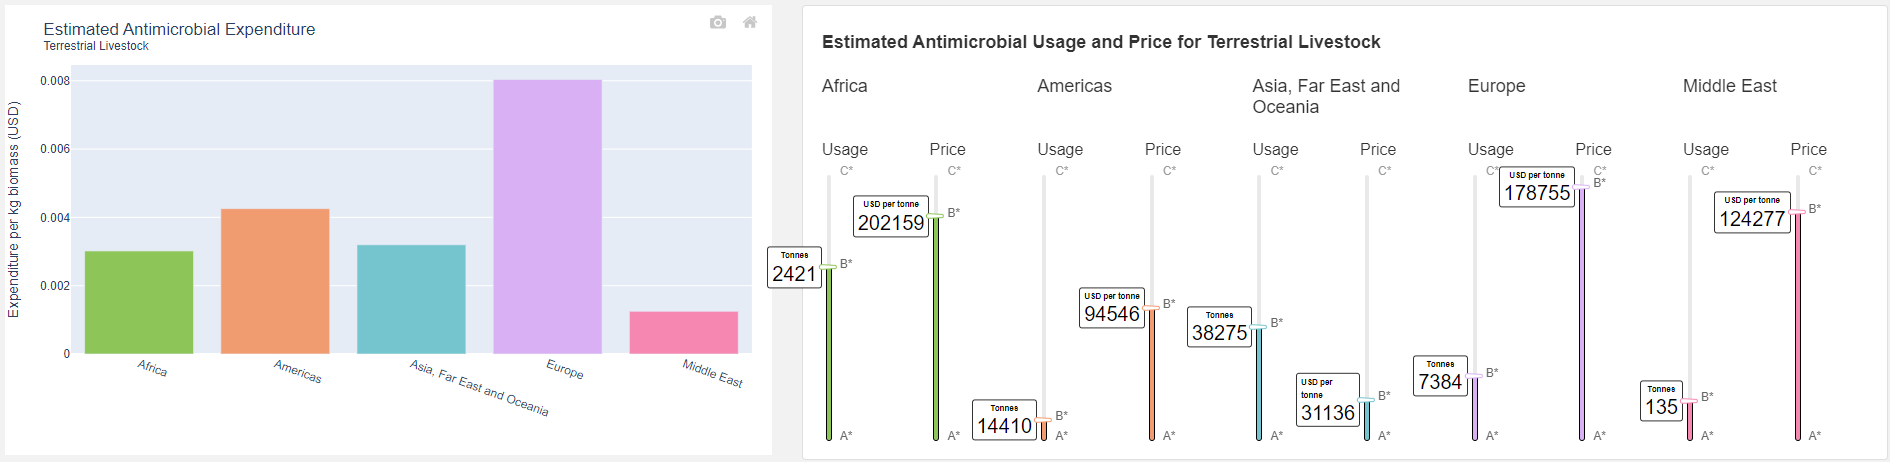
Fig. 14 Antimicrobial expenditure with adjustable usage and price#
Usage Estimates
Illustrative antimicrobial usage values are produced as follows:
A:
Limited to countries reporting total antimicrobial usage to WOAH. Estimate for terrestrial livestock based on terrestrial biomass as a proportion of total biomass. Extended to 2020 by assuming the trend from 2016-2018 continues. All components sourced from WOAH 2018.
B:
Estimate A extrapolated to whole region based on the proportion of terrestrial biomass for the region represented in the countries reporting. Source: WOAH 2018.
C:
Whole-region estimate for terrestrial livestock from Mulchandani et al., 2023.
Price Estimates
Illustrative price values are produced for each region as follows. The most consistent data is from the European Medicines Agency regarding prices for Europe. Prices for other regions are extrapolated from this and OECD data.
Europe:
All prices for Europe are from the European Medicines Agency.
Low: the average price in 2020.
Medium: the average price in 2019.
High: the average price in 2018.
Americas:
Low: the average price in Brazil. Source: OECD Brazil.
Medium: midpoint between high and low estimates.
High: the lower average price reported in Europe.
Asia, Far East and Oceania:
Low: the price of Tetracyclin in China. Source: OECD China.
Medium: Source: OECD China.
High: the lower average price reported in Europe.
Africa:
Low: the average price in Brazil. Source: OECD Brazil.
Medium: 22% increase from price in Europe.
High: 42% increase from price in Europe.
Middle East:
Low: the average price in Brazil. Source: OECD Brazil.
Medium: 25% decrease from price in Europe.
High: 15% decrease from price in Europe.